How to Reduce Unplanned Fleet Downtime



Every vehicle sitting idle costs roughly $448 to $760 a day, and about 78% of the breakdowns that cause it could have been prevented. Downtime is not only a maintenance problem. It is a revenue problem, and most of it is within your control.
What downtime actually costs
The repair bill is the smallest part of a breakdown. Add the tow, the missed load or delivery window, the driver still on payroll while the truck sits, the rental or spare unit, and the disruption that ripples through the rest of the schedule. The direct repair is a line item. The lost day is the real cost.
Across a full year, unplanned downtime runs roughly $3,500 to $5,200 per vehicle. On a fleet of 100 trucks, that is a six-figure loss that never shows up as a single invoice, which is exactly why it goes unmanaged.
The anatomy of downtime
Most unplanned downtime is not one dramatic failure. It is an accumulation of small delays: a PM that slipped, a fault code nobody read, a diagnosis that took a day, a part that was not on the shelf, a vendor that took three days to call back. Each of those is a separate cause, and each one is a separate lever you can pull.
That is the useful way to think about it. If 78% of breakdowns are preventable, then downtime is not the cost of doing business. It is a set of specific, fixable problems. The rest of this post walks the four biggest levers and how to measure whether you are actually moving them.
Lever 1: preventive maintenance compliance
Preventive maintenance is the cheapest downtime you will ever avoid. Done on schedule, it catches wear before it becomes a failure on the road. Consistent scheduled maintenance cuts overall maintenance costs by 20 to 30%, and it converts unplanned roadside events into planned shop visits you control.
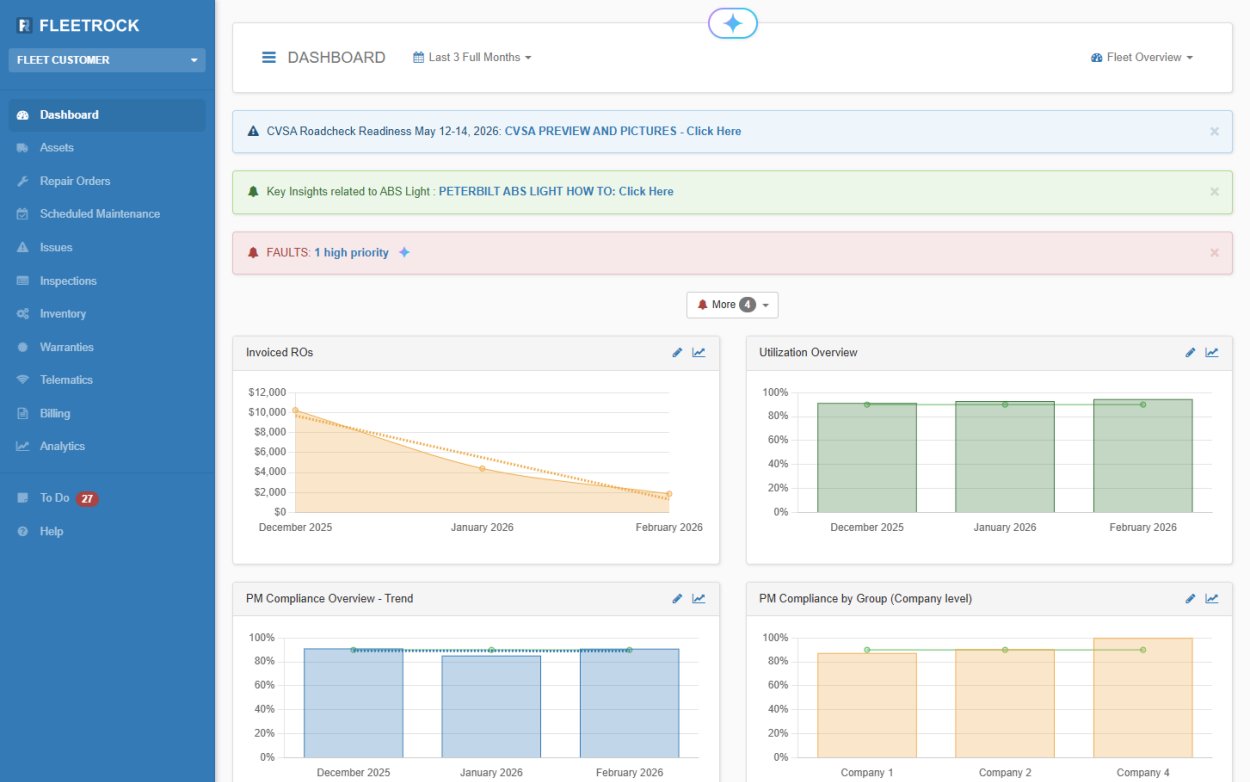
The catch is compliance. A PM program on paper does nothing if services slip when the shop gets busy. The number to watch is your PM compliance rate, and small gains here pay off fast. Southwind raised PM compliance by 38% after moving onto one platform, and their uptime moved with it.
Lever 2: catch failures early with data
Some failures will not wait for the next PM. This is where prediction earns its keep. Machine-learning models can flag a component failure 20 to 45 days before it happens, with 85 to 95% accuracy, by reading the same telematics and sensor data your vehicles already produce. Deloitte has reported that predictive maintenance can cut breakdowns by up to 70%.
You almost certainly already have the raw data. Most fleets collect telematics feeds today and do nothing predictive with them. AI Predictive Maintenance reads that data and predicts when components will fail, so your team intervenes before a failure becomes downtime.
Lever 3: faster diagnosis and shop turnaround
When a vehicle does come in, every hour in the bay is a downtime hour. Diagnosis is often the slowest part. A single connected vehicle can throw around 8,000 fault codes a year, and only a handful actually require action, so the hard part is knowing which ones matter.
AI Fault Code Analysis translates fault codes into a plain-English interpretation and builds an action plan for the shop or the roadside. A technician who walks up to the vehicle already knowing the likely cause and the fix spends less time diagnosing and more time repairing. Tie that to clean repair orders and the job moves.
Lever 4: parts availability and vendor coordination

A correctly diagnosed vehicle still sits if the part is not on the shelf or the outside vendor is slow to respond. Parts delays and vendor lag are two of the most common reasons a one-hour repair becomes a two-day wait, and they are the causes fleets track the least.
Real parts and inventory visibility tells you what is in stock before the vehicle arrives, so you order ahead instead of after. For outside work, tracking vendor turnaround gives you the leverage to hold slow vendors accountable or route the work elsewhere.
The levers connect
Here is what separates a fleet that cuts downtime from one that just tracks it. On separate tools, each lever is a handoff, and every handoff is a delay. On one platform, a predicted failure becomes a work order, becomes a scheduled repair, becomes a parts order, without anyone leaving the system or retyping a thing. Fleetrock builds its AI capabilities across the whole workflow rather than bolting on a single tool, so the four levers stop being four separate projects and start being one motion.
How to measure downtime so you can manage it
You cannot cut what you do not measure. Four numbers tell you almost everything: the ratio of unplanned to planned repairs, mean time to repair, PM compliance rate, and downtime hours per vehicle. Track them per unit and the picture sharpens further, because downtime is rarely spread evenly. A small number of assets usually drives most of it.
Analytics that surface those numbers automatically turn downtime from a vague frustration into a managed metric. Once you can see which vehicles, which shops, and which vendors cost you the most idle time, you know exactly which lever to pull first.
Start with the vehicles that cost you most
Downtime is preventable more often than not, and the fleets that treat it that way pull ahead a little more every quarter. Fleetrock customers see a 50% average gain in uptime, and Southwind lifted its own uptime by 13% while recovering three weeks of administrative time in the process. You do not need to fix all four levers at once. Start by measuring where your downtime actually comes from, then pull the lever that costs you the most.
See how Fleetrock's AI cuts downtime across the whole workflow on the Fleetrock AI page.